|
|
|
|
|
|
|
|
||||||||
|
|
|
|
|
|
|
|
||||||||
|
|
|
|
CarOrganizer 3.0Home... Input / Output Evaluation Driver's Log Full Version CarOrganizer features a many ways to visualize your data graphically. Here you find discriptions of charts for fuel consumption, mileage, overall-expenses and for vehicle comparison.
In the main menu "Tools" - "Graphic Evaluation" you can start the graphical evaluation. Fuel consumption, fuel costs, mileage and overall costs for the currently selected vehicle will be presented to you in clearly arranged charts... 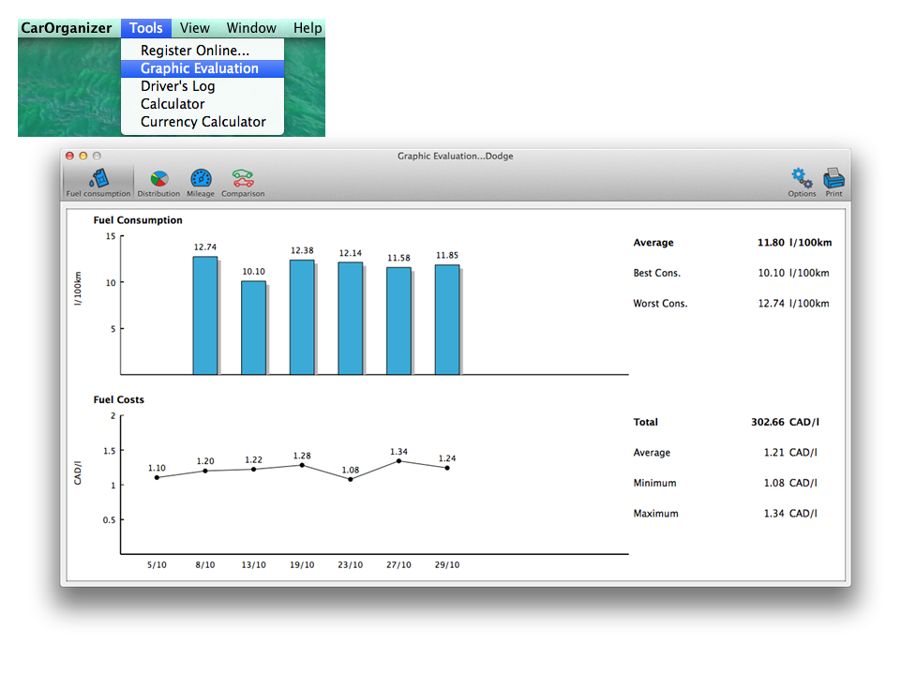 ...You can show the overall costs as pie- or column chart. In the "View" menu the time period for which the data should be shown can be selected (only for Full Version). 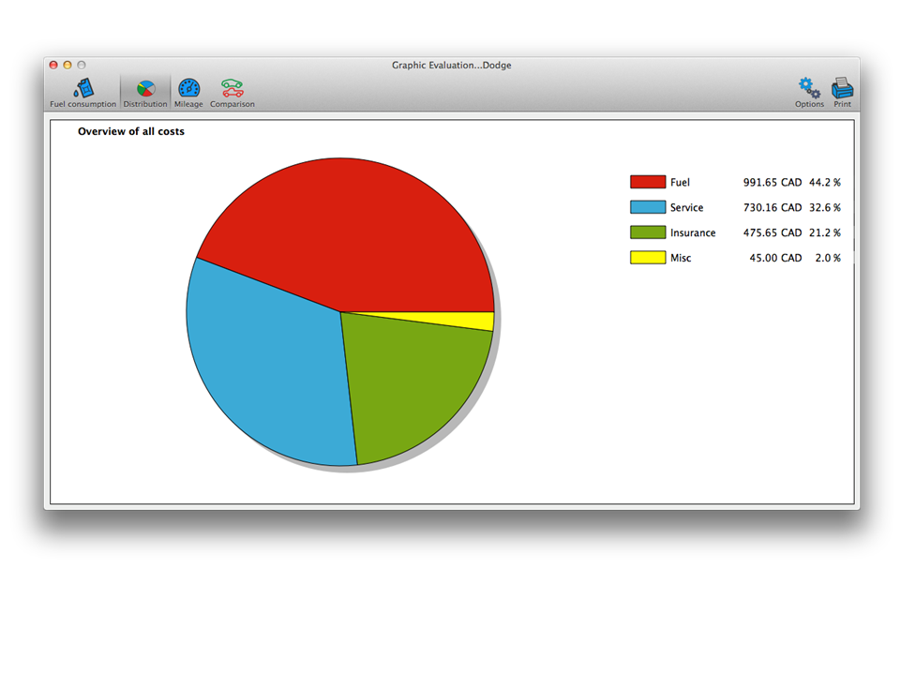
|
|
|
|
||||||||
|
|
|
|
|
|
|
|
||||||||

